The graphs below show the price-to-book ratio on the y-axis and the Shiller Price to Earnings CAPE ratio on the x-axis. The higher the numbers (moving the plot point up and to the right), the more expensive/overvalued the country’s stock market.


Today most of the world stock markets are relatively inexpensive or fairly valued, especially compared to the United States and India which have moved off the chart toward outer space overvaluation levels.
The US market is currently trading 31% higher than in the period 1995-2024. In contrast, Emerging America, Developed Asia and Emerging Asia are attractive, trading 29%, 21% and 7% below their historical valuation averages.

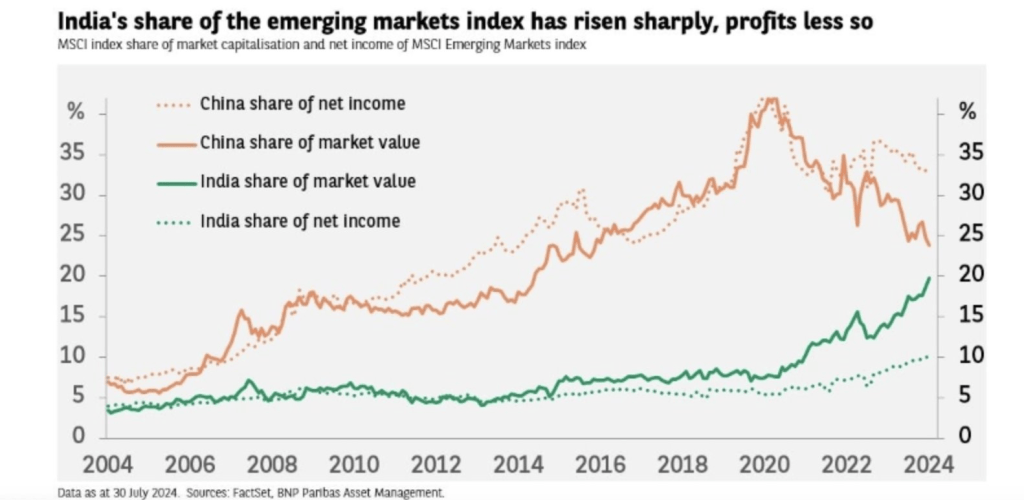
China and India have been oppositive stories since 2020 in terms of their stock prices (dark lines) and their net income (dotted lines):
Sources: Norbert Keimling and Meb Faber
